Code Examples
Basic Usage
Pie Chart
@Composable
private fun AddDefaultPieChart() {
    val dataSet = listOf(8.0f, 23.0f, 54.0f, 32.0f, 12.0f, 37.0f, 7.0f, 23.0f, 43.0f)
        .toChartDataSet(
            title = stringResource(R.string.pie_chart),
            postfix = " °C"
        )
    PieChart(dataSet)
}
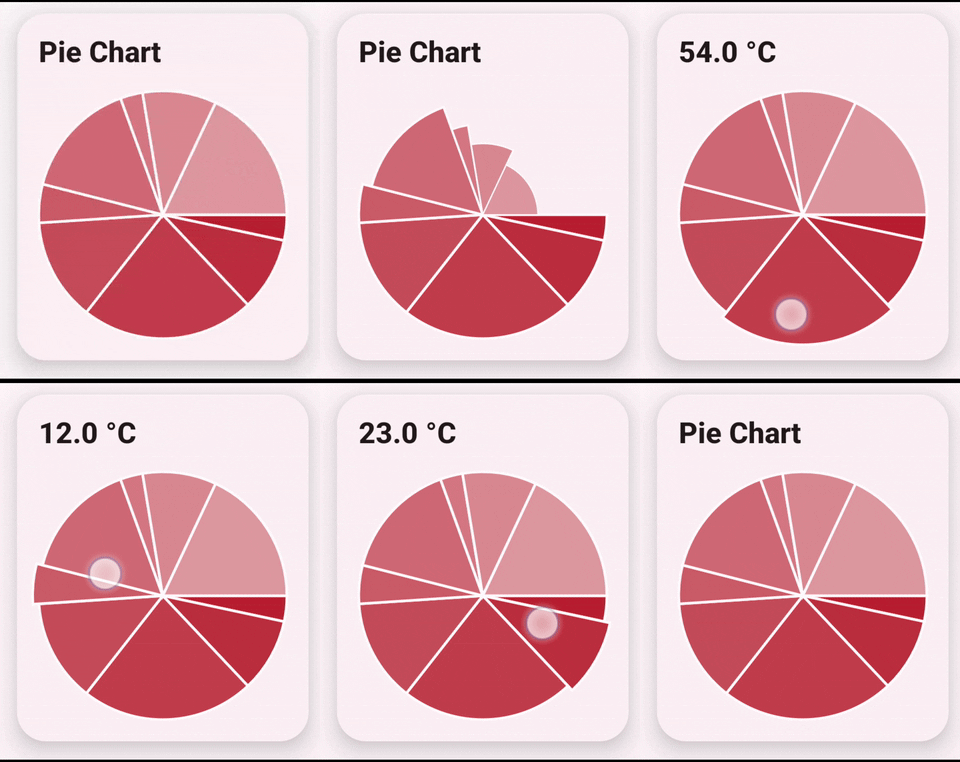
Pie Chart with default styling
Line Chart
@Composable
private fun AddDefaultLineChart() {
    val dataSet = listOf(
        8f, 23f, 54f, 32f, 12f, 37f, 7f, 23f, 43f
    ).toChartDataSet(
        title = stringResource(R.string.line_chart)
    )
    LineChart(dataSet)
}
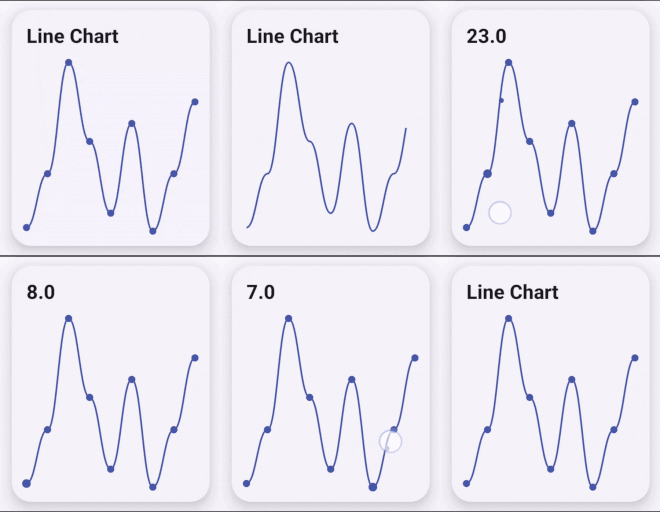
Line Chart with default styling
MultiLine Chart
@Composable
private fun AddDefaultMultiLineChart() {
    val items = listOf(
        "Cherry St." to listOf(26000.68f, 28000.34f, 32000.57f, 45000.57f),
        "Strawberry Mall" to listOf(15261.68f, 17810.34f, 40000.57f, 85000f),
        "Lime Av." to listOf(4000.87f, 5000.58f, 30245.81f, 135000.58f),
        "Apple Rd." to listOf(1000.87f, 9000.58f, 16544.81f, 100444.87f)
    )

    val dataSet = items.toMultiChartDataSet(
        title = stringResource(R.string.line_chart),
        prefix = "$",
        categories = listOf("Jan", "Feb", "Mar", "Apr")
    )

    LineChart(dataSet)
}
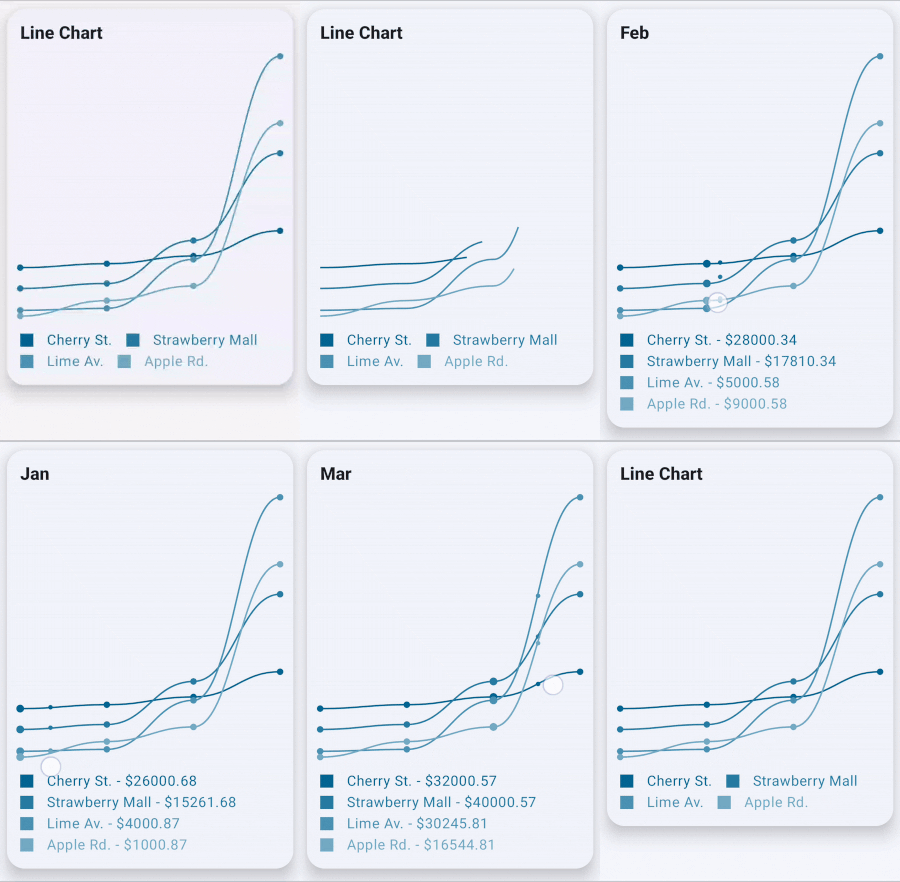
MultiLine Chart with default styling
Bar Chart
@Composable
private fun AddDefaultBarChart() {
    BarChart(
        dataSet = listOf(100f, 50f, 5f, 60f, -50f, 50f, 60f)
            .toChartDataSet(
                title = stringResource(R.string.bar_chart),
                prefix = "$"
        )
    )
}
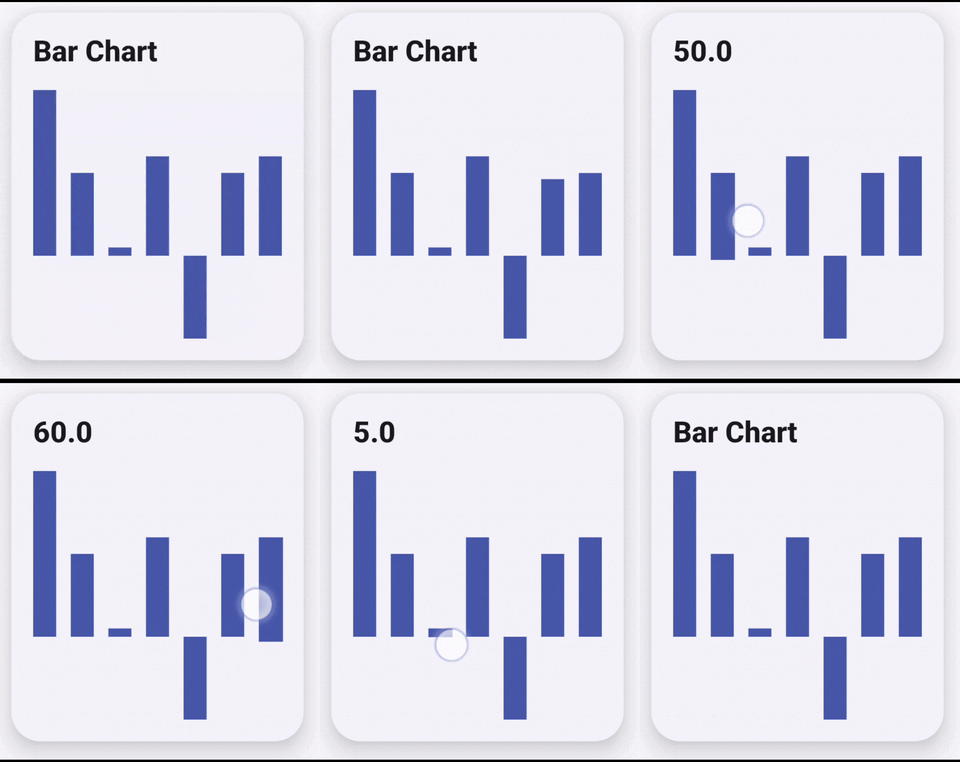
Bar Chart with default styling
Stacked Bar Chart
@Composable
private fun AddDefaultStackedBarChart() {
    val items = listOf(
        "Cherry St." to listOf(8261.68f, 8810.34f, 30000.57f),
        "Strawberry Mall" to listOf(8261.68f, 8810.34f, 30000.57f),
        "Lime Av." to listOf(1500.87f, 2765.58f, 33245.81f),
        "Apple Rd." to listOf(5444.87f, 233.58f, 67544.81f)
    )

    val dataSet = items.toMultiChartDataSet(
        title = stringResource(R.string.bar_chart),
        prefix = "$",
        categories = listOf("Jan", "Feb", "Mar")
    )

    StackedBarChart(dataSet)
}
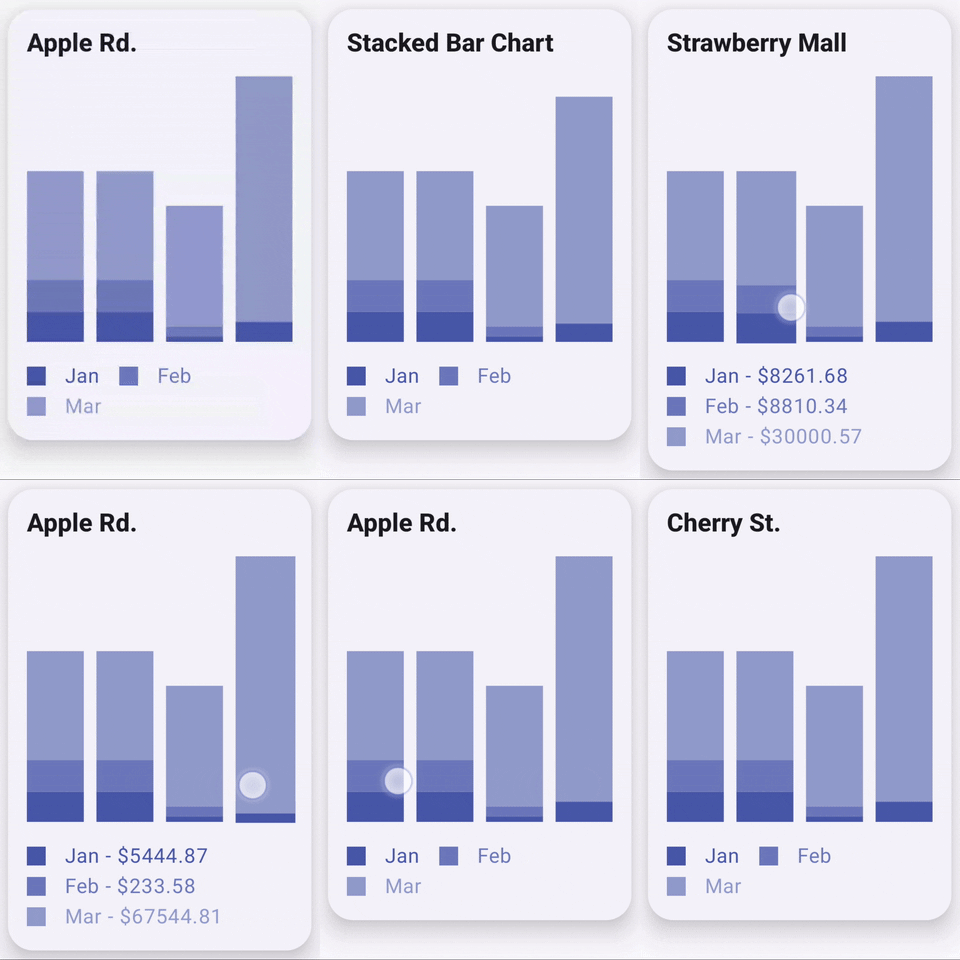
Stacked Bar Chart with default styling
Customizing Chart Styles
Each chart type has a Defaults.style() method that allows you to customize its appearance:
Pie Chart
@Composable
private fun AddCustomPieChart() {
    val pieColors = listOf(
        navyBlue, darkBlue, deepPurple, magenta, darkPink, coral, orange, yellow
    )

    val style = PieChartDefaults.style(
        borderColor = Color.White,
        donutPercentage = 40f,
        borderWidth = 6f,
        pieColors = pieColors,
        chartViewStyle = ChartViewDemoStyle.custom(width = 200.dp)
    )

    val dataSet = listOf(8, 23, 54, 32, 12, 37, 7, 23, 43)
        .toChartDataSet(
            title = stringResource(R.string.pie_chart),
            postfix = " °C"
        )

    PieChart(dataSet = dataSet, style = style)
}
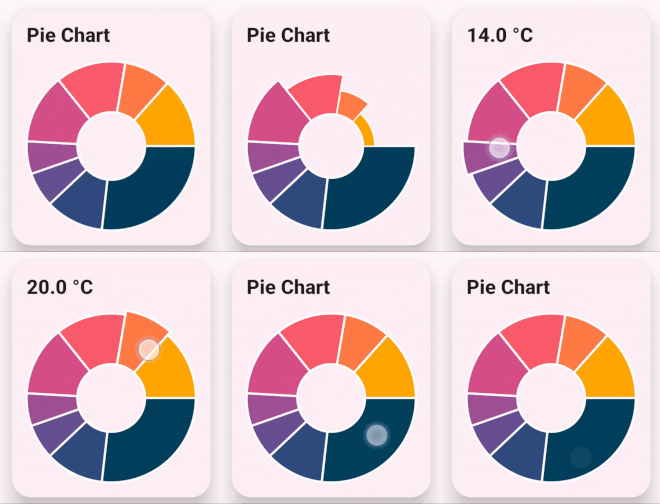
Pie Chart with custom styling
Line Chart
@Composable
private fun AddCustomLineChart() {
    val style = LineChartDefaults.style(
        lineColor = ColorPalette.DataColor.deepPurple,
        pointColor = ColorPalette.DataColor.magenta,
        pointSize = 9f,
        bezier = false,
        dragPointColor = ColorPalette.DataColor.deepPurple,
        dragPointVisible = false,
        dragPointSize = 8f,
        dragActivePointSize = 15f,
        chartViewStyle = ChartViewDemoStyle.custom(width = 200.dp)
    )

    val dataSet = listOf("10", "100", "20", "50", "150", "70", "10", "20", "40")
        .toChartDataSet(
            title = stringResource(R.string.line_chart)
        )

    LineChart(dataSet = dataSet, style = style)
}
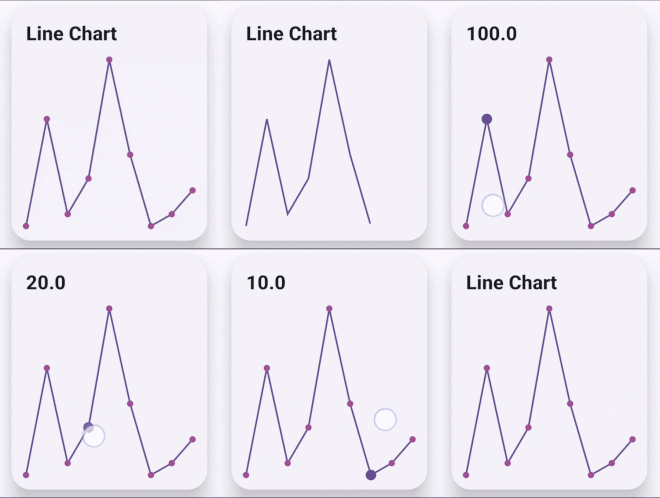
Line Chart with custom styling
MultiLine Chart
@Composable
private fun AddCustomMultiLineChart() {
    val lineColors = listOf(
        navyBlue, darkBlue, deepPurple, magenta
    )
    val style = LineChartDefaults.style(
        lineColors = lineColors,
        dragPointVisible = false,
        pointVisible = true,
        pointColor = ColorPalette.DataColor.magenta,
        dragPointColor = deepPurple,
        chartViewStyle = ChartViewDemoStyle.custom()
    )

    val items = listOf(
        "Cherry St." to listOf(26000.68f, 28000.34f, 32000.57f, 45000.57f),
        "Strawberry Mall" to listOf(15261.68f, 17810.34f, 40000.57f, 85000f),
        "Lime Av." to listOf(4000.87f, 5000.58f, 30245.81f, 135000.58f),
        "Apple Rd." to listOf(1000.87f, 9000.58f, 16544.81f, 100444.87f)
    )

    val dataSet = items.toMultiChartDataSet(
        title = stringResource(R.string.line_chart),
        prefix = "$",
        categories = listOf("Jan", "Feb", "Mar", "Apr")
    )

    LineChart(dataSet = dataSet, style = style)
}
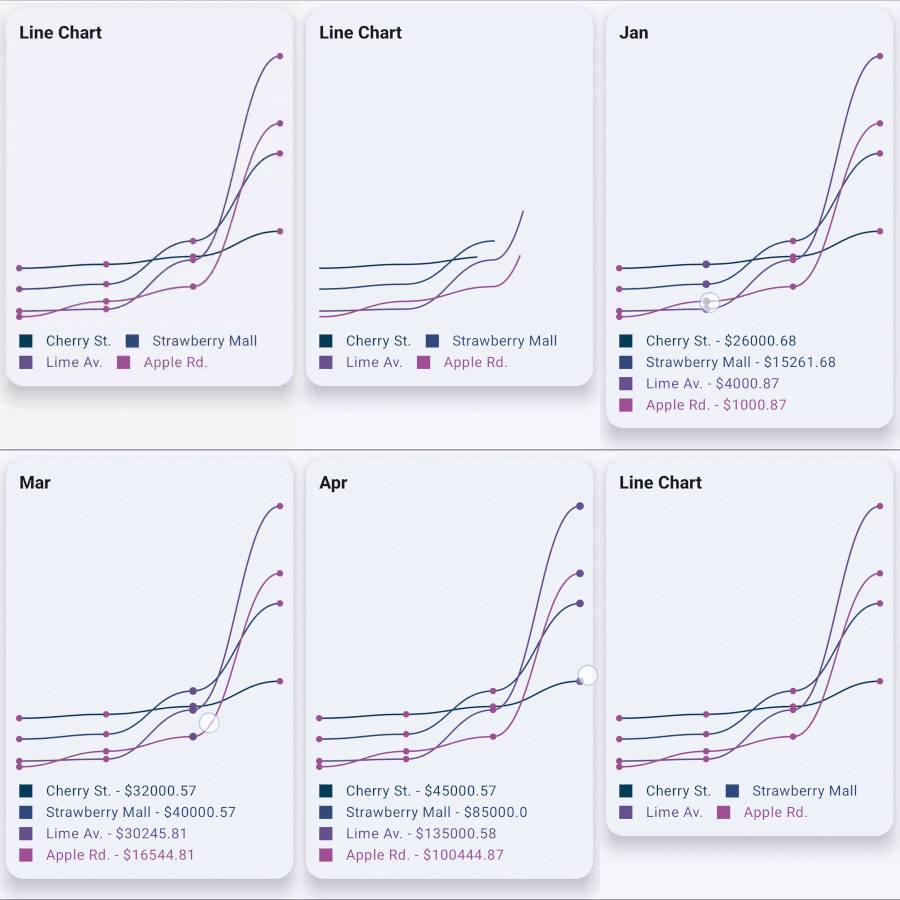
MultiLine Chart with custom styling
Bar Chart
@Composable
private fun AddCustomBarChart() {
    val style = BarChartDefaults.style(
        barColor = ColorPalette.DataColor.deepPurple,
        space = 12.dp,
        chartViewStyle = ChartViewDemoStyle.custom(width = 200.dp)
    )

    BarChart(
        dataSet = listOf(100f, 50f, 5f, 60f, 1f, 30f, 50f, 35f, 50f, -100f)
            .toChartDataSet(title = stringResource(R.string.bar_chart)),
        style = style
    )
}
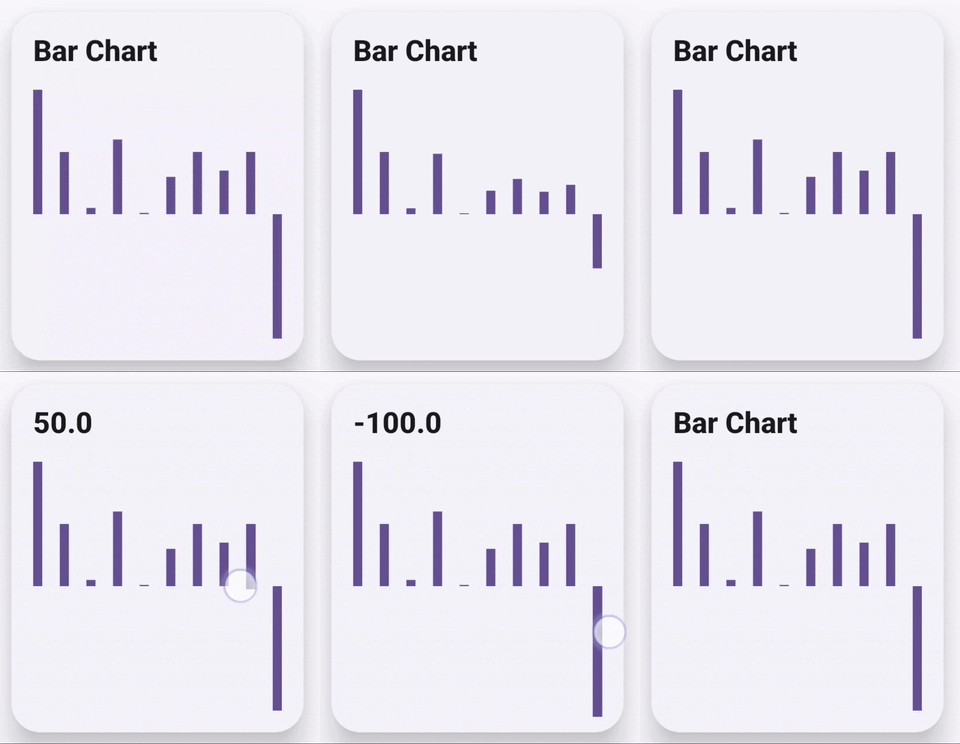
Bar Chart with custom styling
Stacked Bar Chart
@Composable
private fun AddCustomStackedBarChart() {
    val colors = listOf(navyBlue, darkBlue, deepPurple)
    val style =  StackedBarChartDefaults.style(
        barColors = colors,
        chartViewStyle = ChartViewDemoStyle.custom(width = 240.dp)
    )

    val items = listOf(
        "Cherry St." to listOf(8261.68f, 8810.34f, 30000.57f),
        "Strawberry Mall" to listOf(8261.68f, 8810.34f, 30000.57f),
        "Lime Av." to listOf(1500.87f, 2765.58f, 33245.81f),
        "Apple Rd." to listOf(5444.87f, 233.58f, 67544.81f)
    )

    val dataSet = items.toMultiChartDataSet(
        title = stringResource(R.string.stacked_bar_chart),
        prefix = "$",
        categories = listOf("Jan", "Feb", "Mar")
    )

    StackedBarChart(dataSet = dataSet, style = style)
}
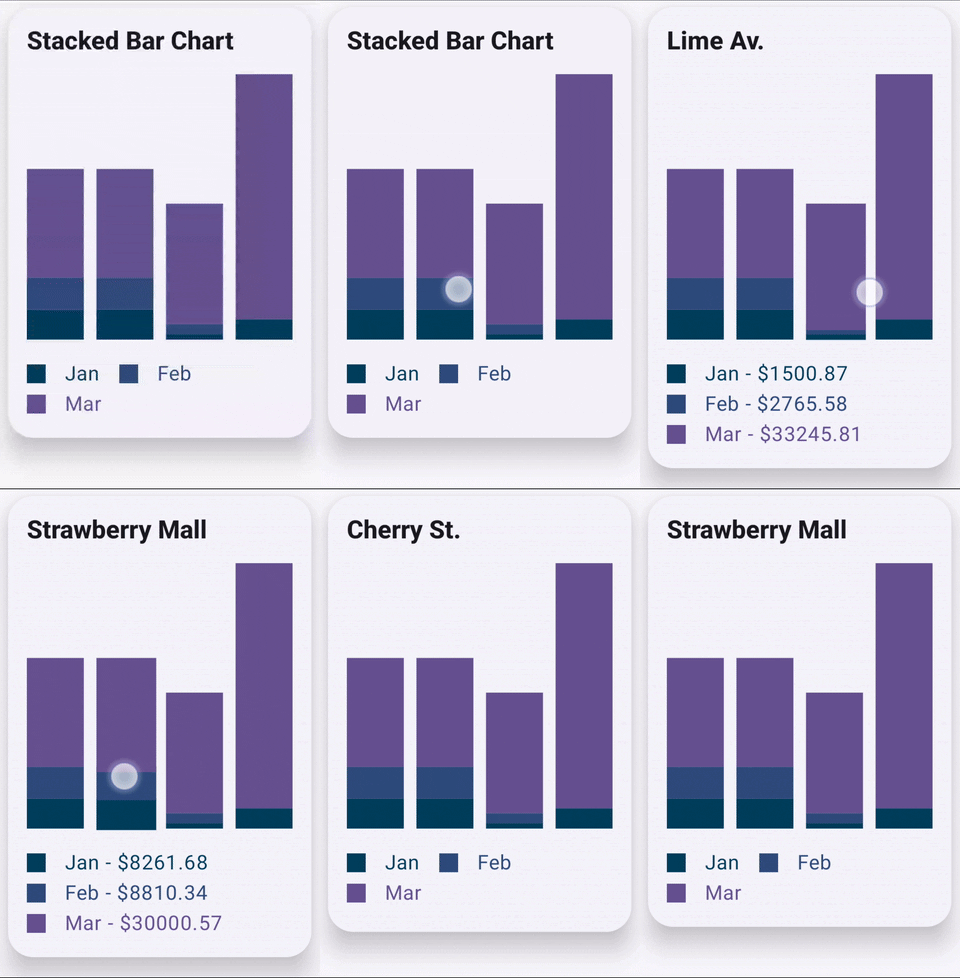
Stacked Bar Chart with custom styling
Next Steps
- Explore the API Documentation for detailed information about all available options
- Try the Interactive Demo to see the charts in action
- Check out these examples for more advanced usage: